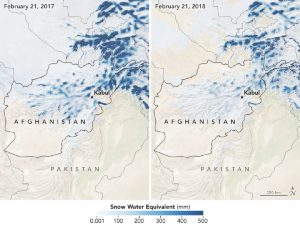
In a reversal from abundant snow conditions in February 2017, the snowpack in Afghanistan in February 2018 was the lowest detected for the month since 2001. That is a concern heading into spring and summer, as snowmelt is an important source of water for crops and irrigation.
The drought is apparent in these maps of “snow water equivalent”—the depth of water that would result if the snow were to completely melt. The top-right map shows conditions on February 21, 2018, amid a low snowpack; the top-left map shows conditions on February 21, 2017. The darkest blue areas indicate where the snow contained the most water. Turn on the image comparison tool to see the difference.
Scientists cannot make direct, physical measurements of snowpack everywhere on the planet. That is where models can help. By combining remotely sensed observations of precipitation, temperature, solar radiation, and wind with information about elevation and topography, a model can estimate how much snow is present. From this, scientists calculate the snow water equivalent (SWE). These estimates can help experts infer where there might be flooding when the snow melts. Conversely, they can help them anticipate and plan for drought if SWE levels are low.

The low snowpack this year is not entirely a surprise; low snowpack often coincides with periods of La Niña. The chart above shows the progression of snow water equivalent in water year 2018 (red line) and water year 2017 (orange line). (A water year begins on October 1 to align with hydrologic seasons.) The blue dashes indicate the average snow water equivalent between 2001-2017.
Notice how snow levels started off slow in early 2018 and 2017 (also amid La Niña conditions). The difference was that in early February 2017, a huge amount of snow fell on Afghanistan. The storm was so extreme that it spurred avalanches that buried villages. That one event was enough to bring snow levels back up to average. In comparison, snowfall in February 2018 increased somewhat but accumulations were still at a record low.

NASA data also show that temperatures this winter have been hotter than usual in the region. The temperature anomaly maps above are based on data from the Moderate Resolution Imaging Spectroradiometer (MODIS) on NASA’s Aqua satellite. It shows land surface temperatures (LSTs) for February 2018 (right) and February 2017 (left), compared to the average since 2002 for the same month. Red colors depict areas that were hotter than average; blues were colder; white pixels were normal. USAID’s Famine Early Warnings Systems Network (FEWS NET) reported that the high temperatures are expected to deplete the snowpack “sooner than normal, resulting in possible irrigation water shortages in April and May.”
“While a big snow event is still possible this year, we’re now midway into March and temperatures are rising, so it is unlikely,” said Amy McNally, a researcher who produces the snow estimates for the Land Information System at NASA’s Goddard Space Flight Center. “At this point, rain may provide some water for the early part of the growing season, but we’d still be concerned about later in the season, given that we don’t have the water stored in the snow pack.”
Various groups are keeping an eye on the situation as the country enters the latter part of the wet season (October to May). A March hazard outlook from the NOAA Climate Prediction Center states: “A drought hazard is posted over much of Afghanistan and portions of adjacent countries as the ongoing, large moisture deficits are likely to negatively impact crops over the coming months.”
NASA Earth Observatory images by Joshua Stevens, using land-surface model (LSM) data courtesy of Amy McNally, Jossy Jacob, and the NASA Land Information System, and temperature anomalies from the Early Warning and Environmental Monitoring (EWEM) program at the U.S. Geological Survey. This story was originally published by NASA’s Earth Observatory.

![man collecting firewood in Rohingya [image by: Mokammel Shuvo]](https://dialogue.earth/content/uploads/2018/03/Roh1-300x200.jpg)